About
This plugin lets you save variable information(variable names + values) and stack trace information from a breakpoint event to a file which can be loaded later and you can navigate the stack frames and see variable values just like in a normal debugging session. Also you can send the file to your colleagues and they can load it into their IDEs and they can see all the breakpoint’s information without going through the same debugging session as you.
Manual
- Install it from the Marketplace
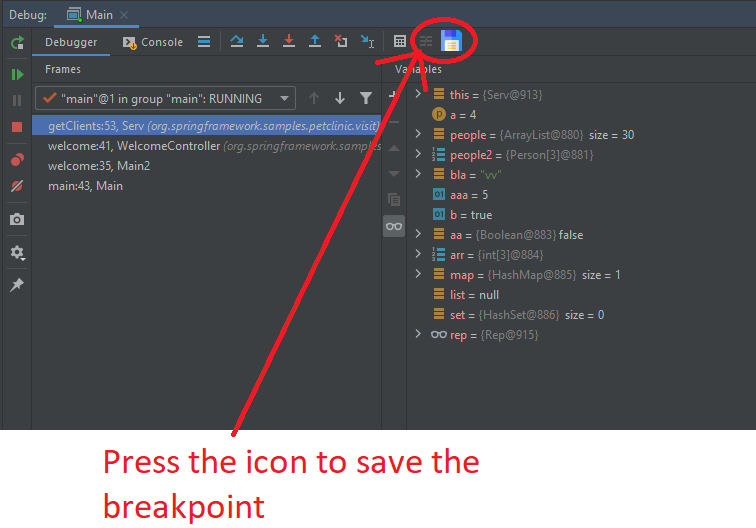
- Run your application with the Debug Runner. Place a breakpoint, when the breakpoint is hit, open the Debugger Tool Window.
- Press the File icon to save the breakpoint related information
- After choosing where to save it, you will be presented with a settings panel:
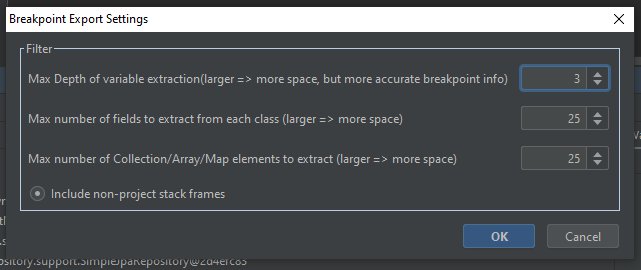
- The larger values you choose, the more time saving will take. There is a limit of 5s on saving, it must be completed in 5s else it will fail, so choose carefully the depth of variables (depth means how many levels of fields are included, so depth = 2 means only the fields of the most outer variables are included (fields of classes which are fields themselved are not included), depth = 1 means no fields at all, only outer variables). Also uncheck
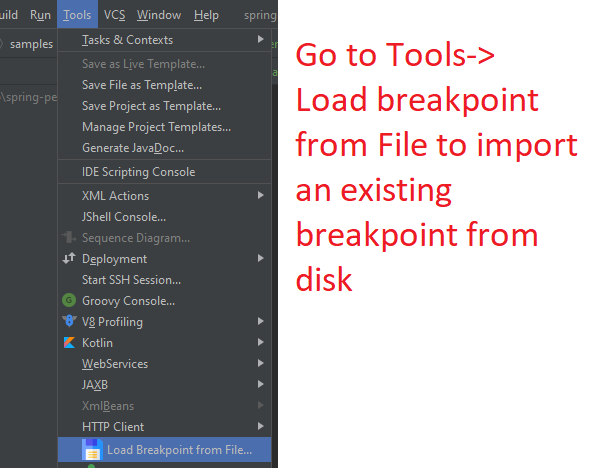
include non project stack framesto save space/saving time. It won’t show stack frames which didn’t happen in your app(IntelliJ shows these stack frames greyed out). - To load an existing breakpoint from a file, go to
Tools -> Load Breakpoint From File
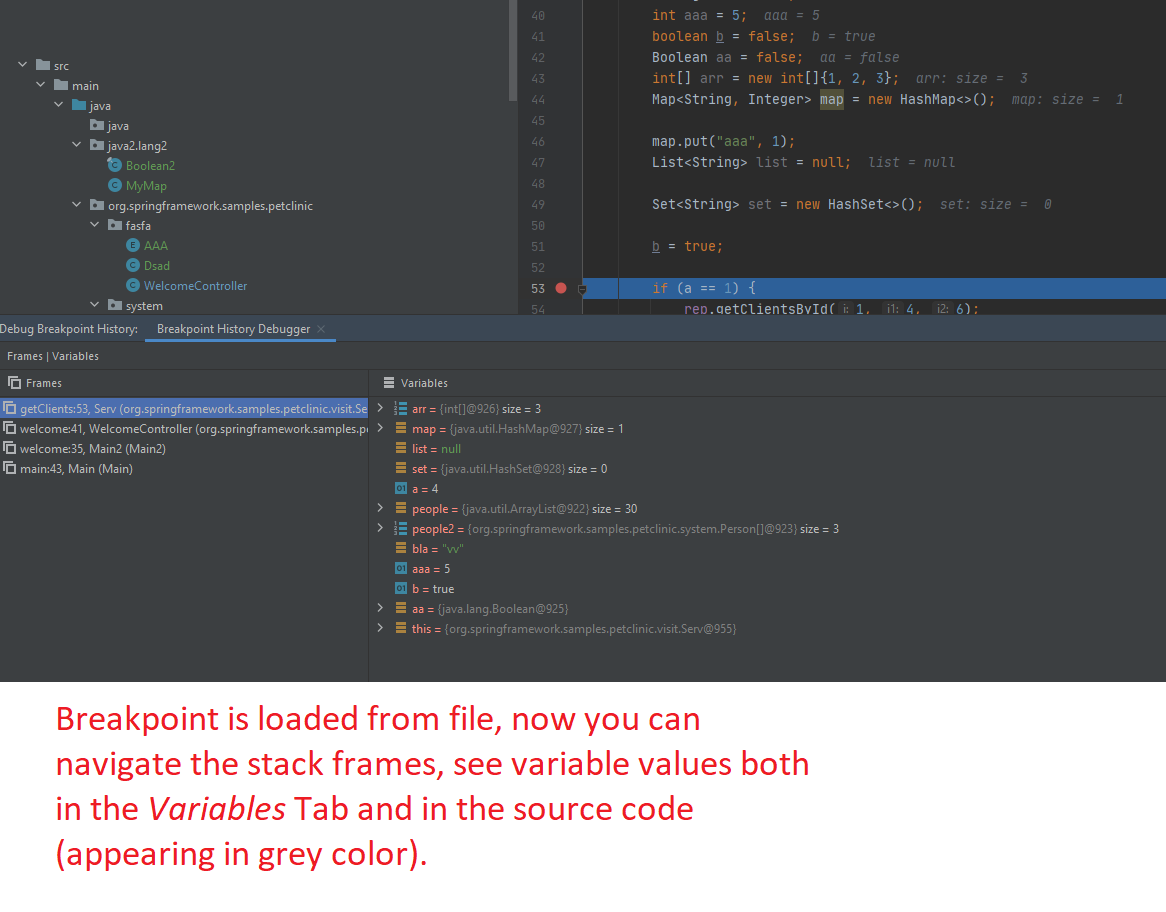
- A new Tool Window will open up and you can navigate stack frames on the left hand side, and see variable information on the right hand side. Variable information also appears next to variables in the source code:
Credits:
Icons made by https://www.flaticon.com/authors/freepik on www.flaticon.com
Variable extraction is based on the code provided by https://github.com/cnhguy/FootPrint
License
GPL
Support
Please check out my other plugins and give a review if you like them