Manual
Youtube Video: https://www.youtube.com/watch?v=EyW-0LeJRuc
- Install it from the Marketplace
Note: If you have a large project go to step 4 before going to step 2. Also, I’d recommend trying out the plugin on some small project like this Spring Boot app: https://github.com/csabagabor/Spring-Boot-Petclinic-app
- Run any project and open the Console Tab. When you are ready to record, press the green recording button.
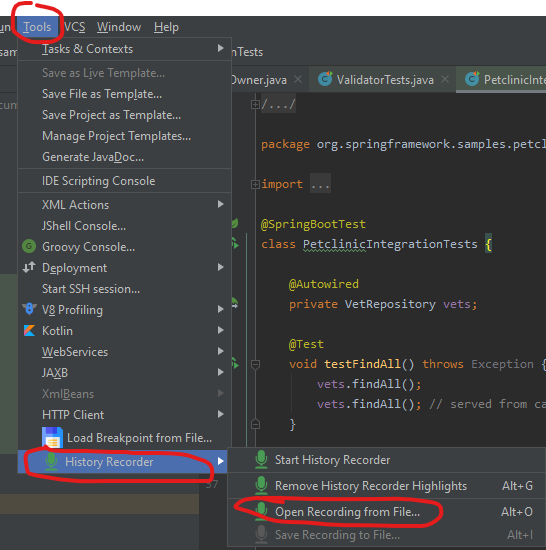
Note: If the button does not appear go to
Tools -> History Recorder -> Start History Recorder
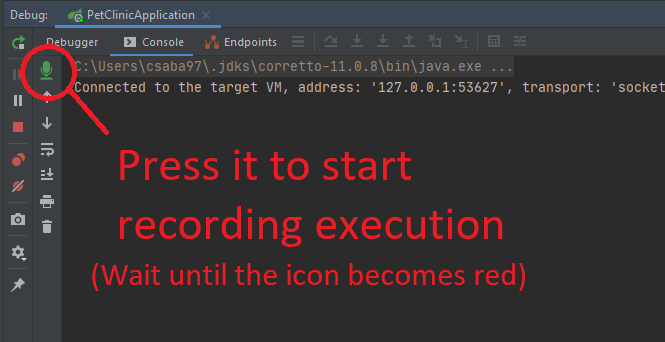
- Now you just have to wait until the button turns red. Also a notification will appear saying, recording is ON. This will take a long time for a large project!!!!! In this case go to step 4
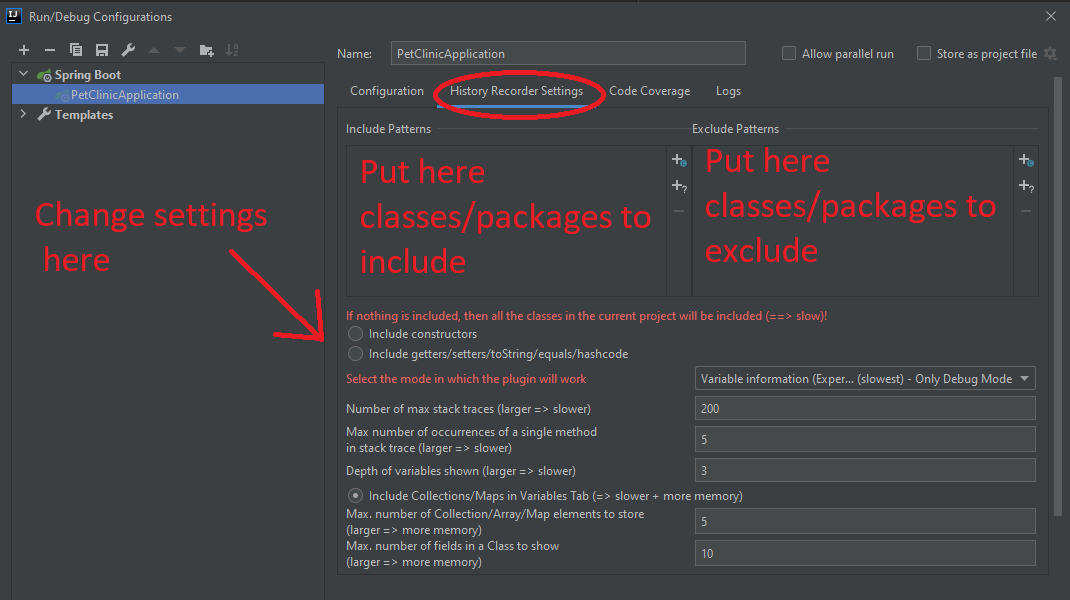
- Go to the Run configuration menu -> History Recorder Settings and include only the classes/packages you want to include. When including a package write
package1.package2.*. After this step you must restart the application.
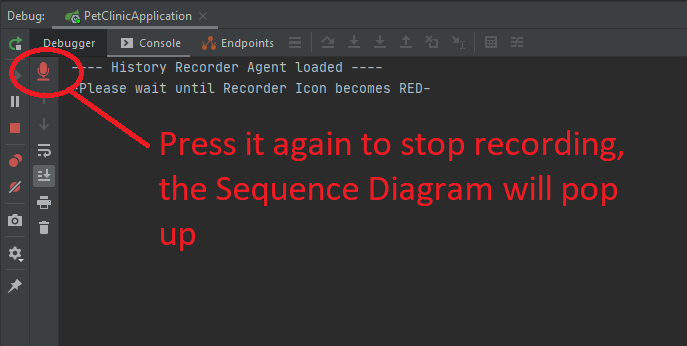
- After recording is ON, you can carry out the actions you want in the app. Everything will be recorded until you press the (now) red recording button.
Note: recording cannot start if the main thread is blocked. So you cannot stop at a breakpoint and start recording. The application must be in a running state. As a workaround, if you want to start recording as soon as the app starts, you can use a
Thread.sleep(1000)and place a breakpoint on it. When the breakpoint is hit, you can start/stop the recording then resume the breakpoint. When thesleep()is over, recording will be already started - Press the red button to stop recording.
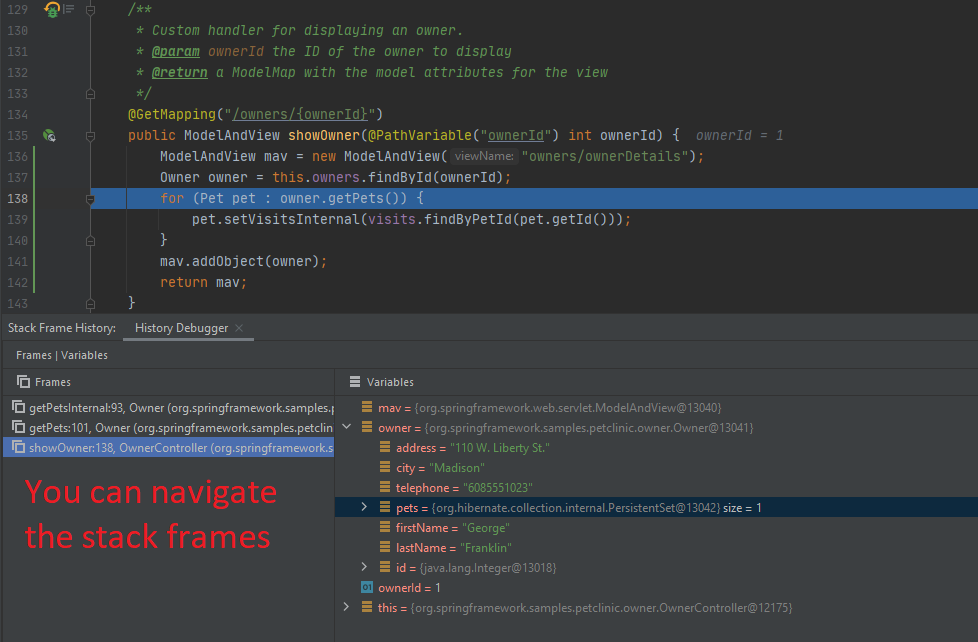
- Wait until the sequence diagram pops up. You can click on methods, arrows on the sequence diagram and it will lead you to the execution point.
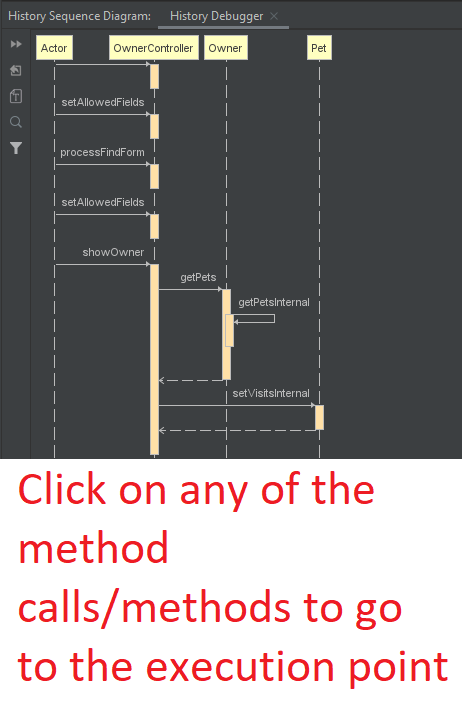
- On the left hand side you can navigate the stack trace and on the right hand side you will be able to see variable values.
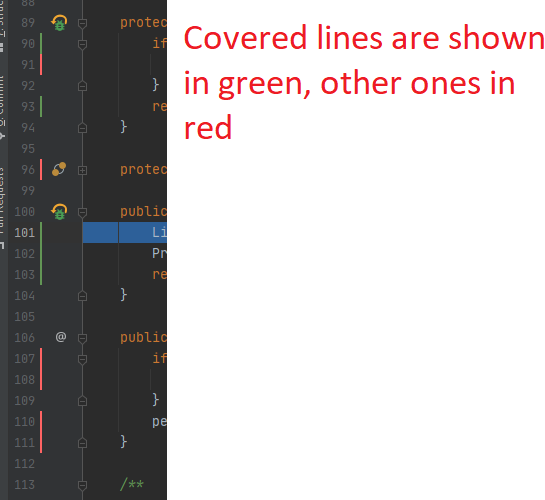
- Also, lines which have been executed are marked green.
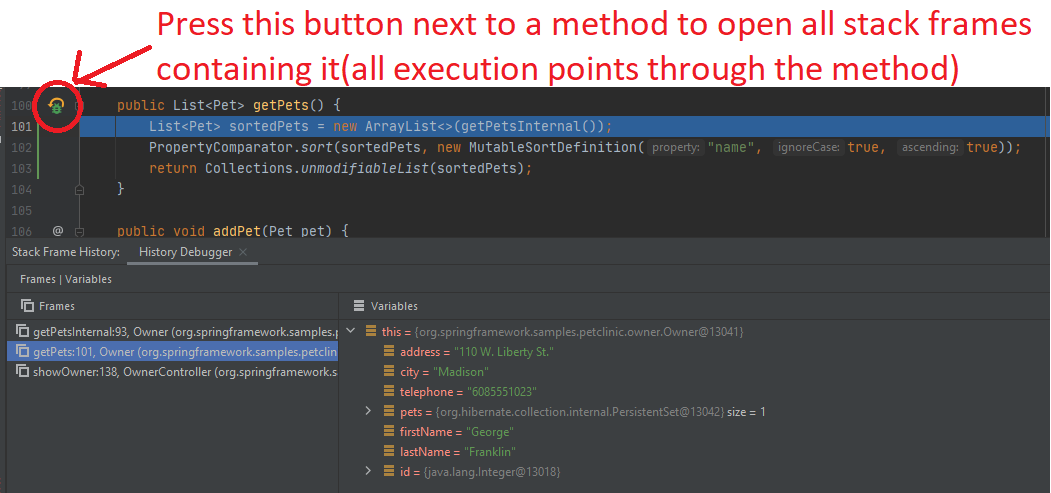
- Also, a button appears next to each method that is included in a stack trace. Press the button to load the stack trace containing that method.
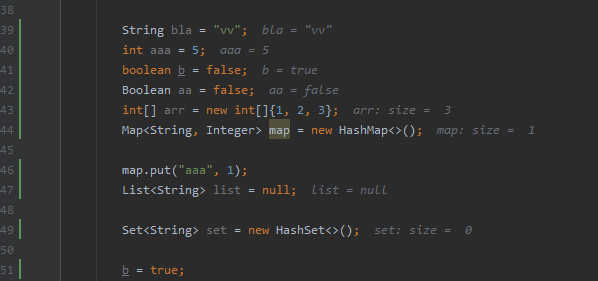
- Also you will be able to see variable information next to variables:
- To delete all the recording information from the source files: icons, green/red lines etc. press
ALT + Gor go toTools -> History Recorder -> Remove History Recorder highlights.
Export/Import Recording
- Go to
Tools -> History Recorder -> Open Recording from file
- To save a recording (only works if you haven’t deleted the recording with ALT + G before): go to
Tools -> History Recorder -> Save Recording to file. - You can send the exported file to anybody. It can be loaded on any OS, on any IntelliJ version >= 2019.3. The same project must be opened.
Run Configuration Settings:
- Include patterns if your project is too large. By default, if you don’t include any patterns, all the classes in your project will be included(=>slow).
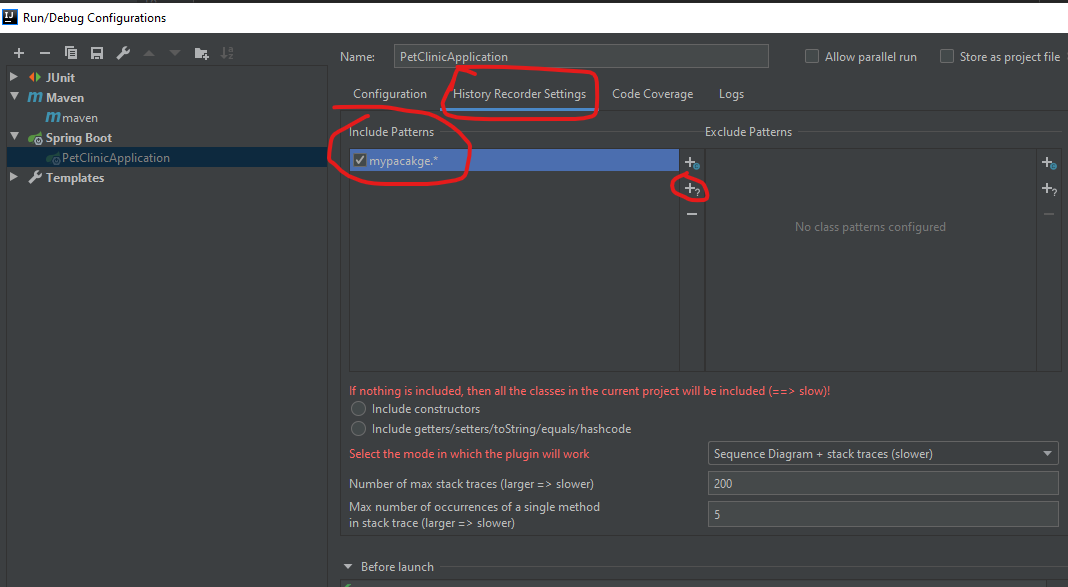
- There are 3 modes in which you can run the agent:
- 1). Only covered lines: fastest option, shows only green/red lines
- 2). Sequence Diagram + stack traces: without variable information, somewhat slower than 1st mode
- 3). Variable information: slowest option. Use it with caution: it might consume a lot of memory for large projects
- Number of stack traces to show: depending on memory consumption and execution time, you can set it to a larger value.

- Max number of occurrence of a single method means how many number of times the same method is shown in the sequence diagram/stack traces. It does not make sense to set it to a high value, because it has a high impact on execution time(there can be methods which are called several thousand times…).
- There are other options to limit the memory consumption like limit the number of collection items, number of fields to include, include getters/setters/constructors etc.
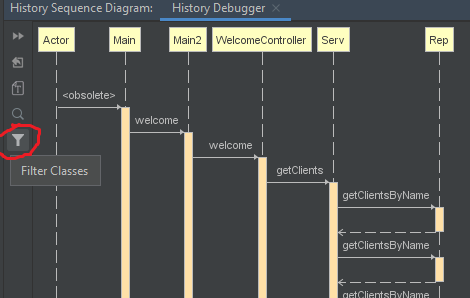
Sequence Diagram filtering options:
- Filter classes: only include stack frames which have the selected classes as their last execution points:
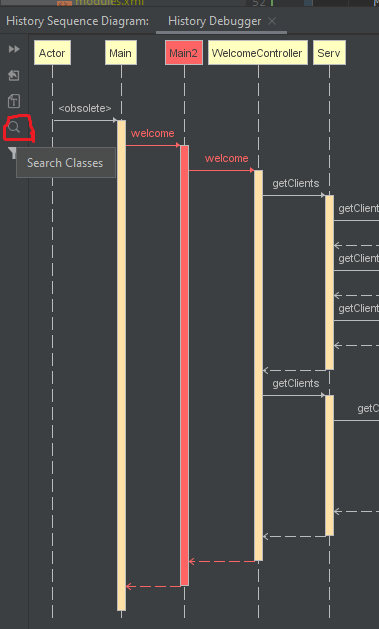
- Search: Searched classes and their methods will appear in red.
- Export to png.
- Zoom in/out with mouse + scroll.
- Bird view in the right bottom corner.
Issues and limitations
Note: only for debug purposes, not for general use: There is a hack to enable and see debug logs in a JFrame. To enable it, just write
HISTORY_MAGICinside the exclude packages menu in the Run Configuration tab. A new Window will pop up. You can then open an issue on Github and attach the log messages. This will help me solve the problem… After you are done, removeHISTORY_MAGICfrom the exclude list.
- Currently does not work well with the Maven Template inside IntelliJ. The settings Tab is not shown. This means that include/exclude filters cannot be set. This will be fixed.
- Only a single application can be recorded in the same project at a given time. Trying to record multiple apps will result in race confitions.
- Sometimes the recorder icon dissapears or becomes grey. In this case click on the Console Window(where the logs appear) next to the icon.
Future development
- Show full variable information when hovering over variable (like in IntelliJ Debugger)
- Change instrumented patterns/filters during runtime
- Show accurate coverage percentages next to file names(currently it is calculated based on the total number of lines and not based on the lines containing executable code)
- Kotlin support
Credits:
Recording button's Icon made by https://www.flaticon.com/authors/freepik on
www.flaticon.com
Variable extraction is based on the code provided by https://github.com/cnhguy/FootPrint
Sequence diagram provided by https://github.com/Vanco/SequencePlugin
IntelliJ IDEA Code Coverage Agent: https://github.com/JetBrains/intellij-coverage
License
GPL
Support
Please check out my other plugins and give a review if you like them